

Appearance
Analytics Overview
Track impressions, clicks, orders, and revenue for every campaign.
Overview
The Analytics views show how your promotions are performing - from a storewide summary on the Home dashboard down to day-by-day detail for a single campaign.
Benefits
- See which promotion type is earning the most revenue at a glance
- Drill into any individual campaign for its own performance history
- Understand the full funnel from views to clicks to completed orders
Where to Find It
Apps → BRIX: BOGO, Upsell & Discount → Home (summary) → "View all" on any promotion type, or "Details" on any individual campaign
How to Use
- From Home, use the date-range control to review your storewide revenue chart and the promotion-type summary table.
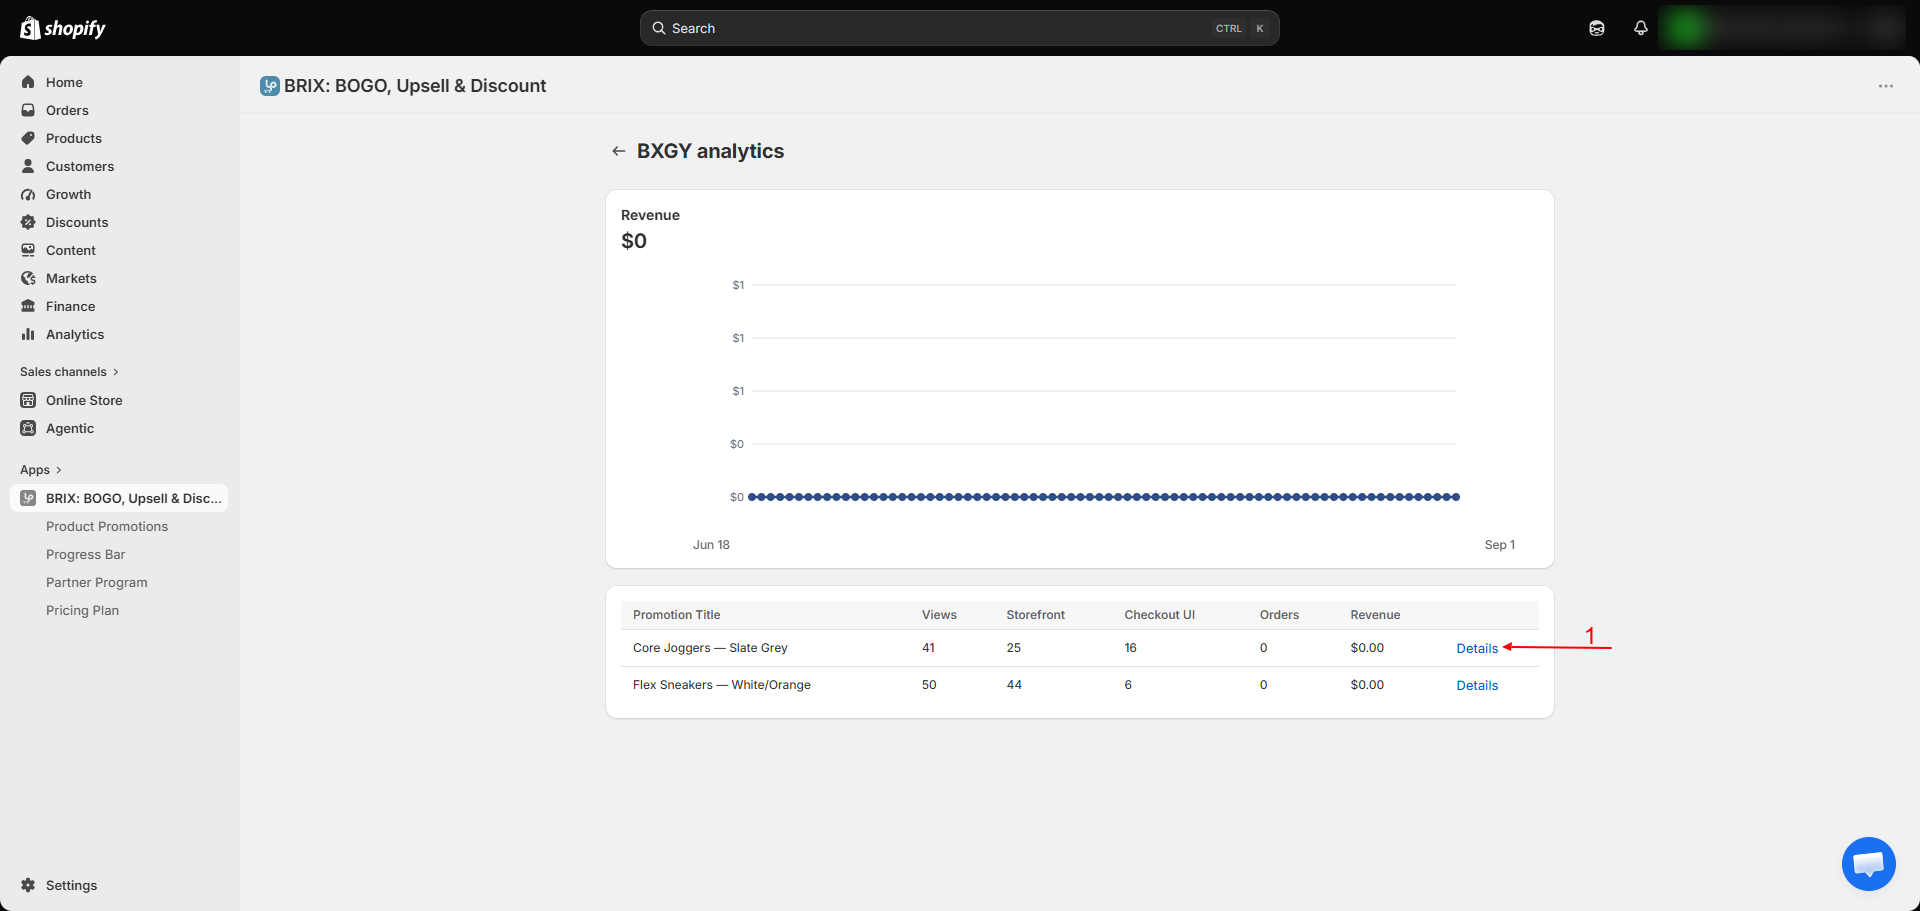
- Click View all next to a promotion type to see every campaign of that type, with its own views, clicks, orders, and revenue.
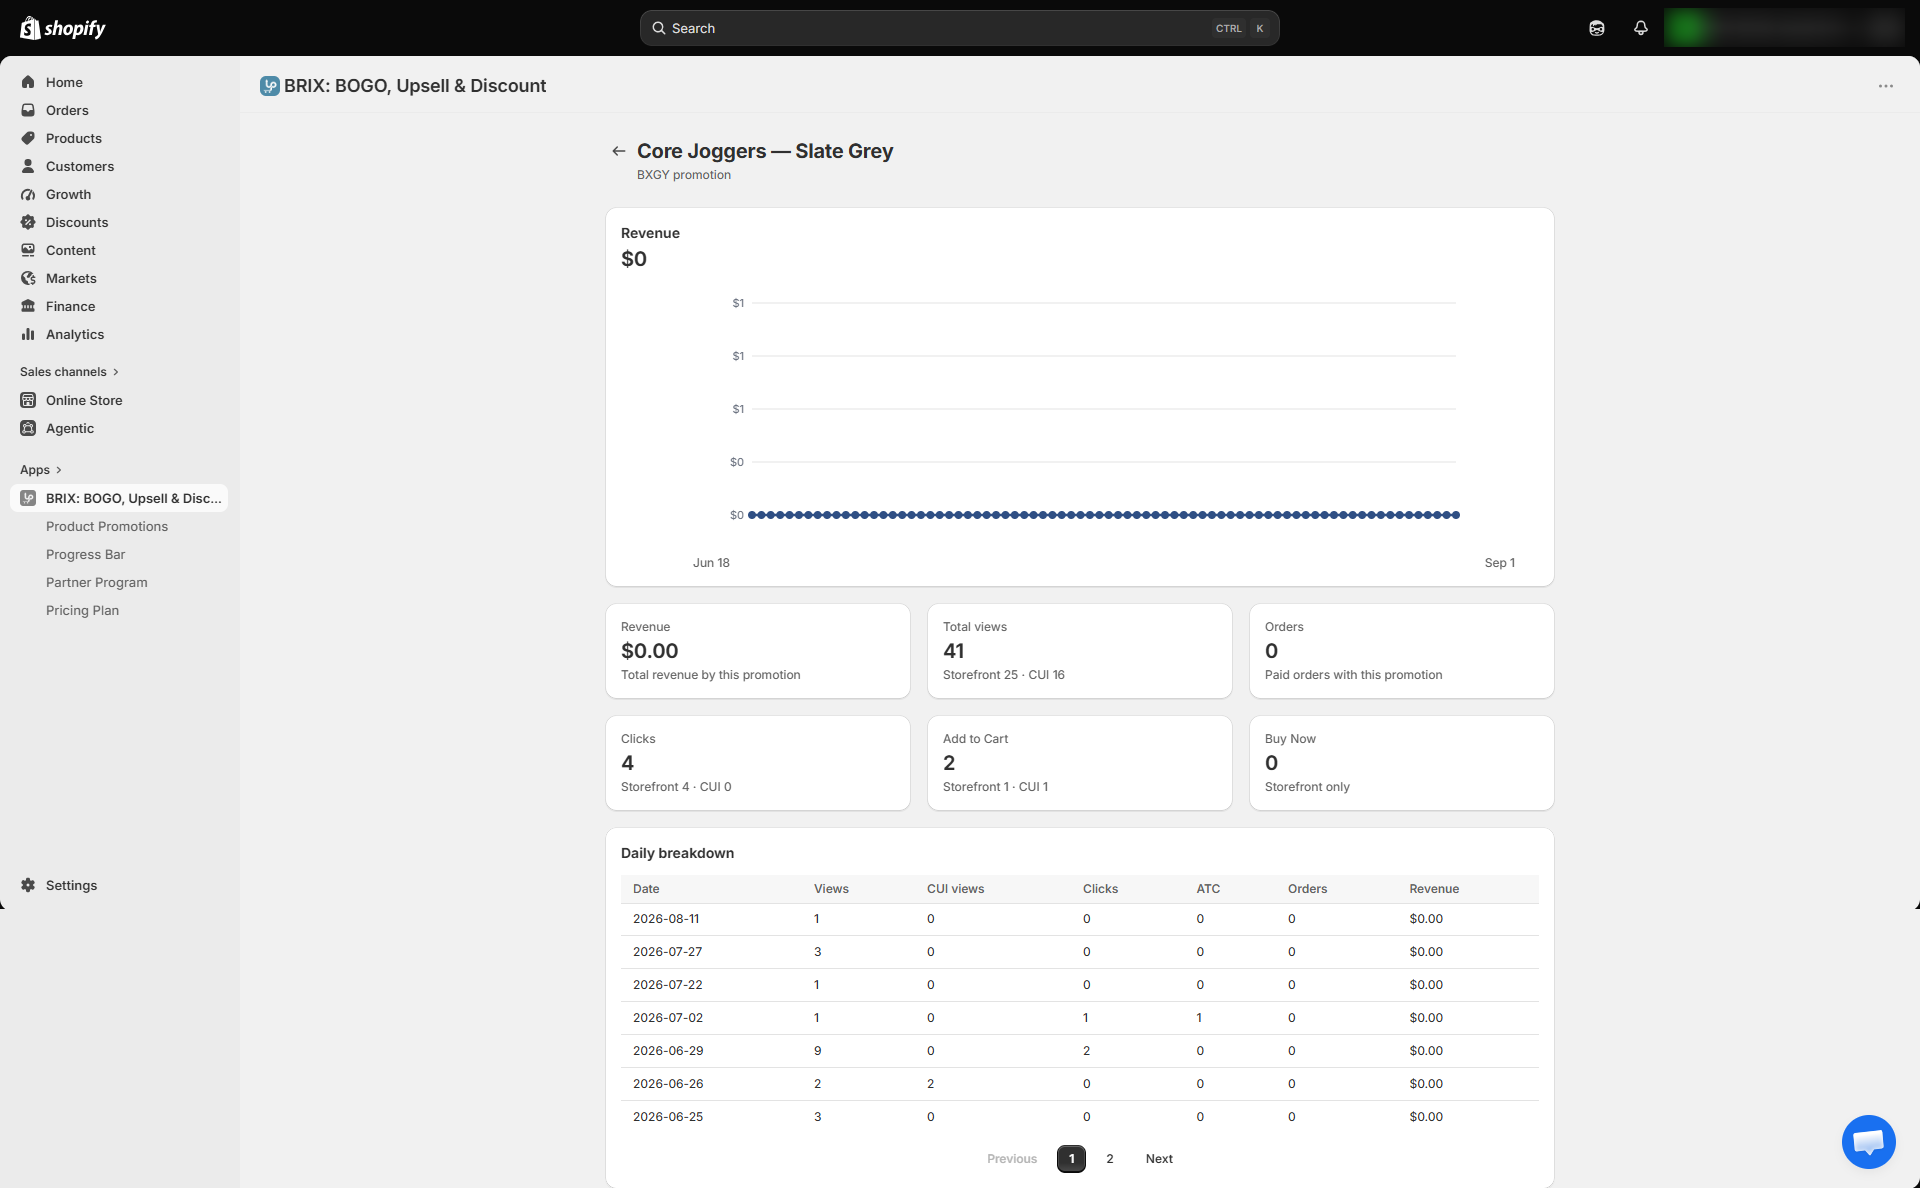
- Click Details on any individual campaign to see its full performance breakdown, including a day-by-day table.
Available Settings
This is a reporting area with no settings to configure. It displays:
Promotion-type and campaign tables
| Metric | What It Means |
|---|---|
| Views | Total times the offer was shown - broken down into Storefront and Checkout UI (Shopify Plus, where enabled) |
| Clicks | How many times a customer interacted with the offer |
| Orders | Completed orders that included this promotion |
| Revenue | Revenue from orders that included this promotion |
Individual campaign detail adds two more metrics, each also split by Storefront vs. Checkout UI:
| Metric | What It Means |
|---|---|
| Add to Cart | How many times the offer's item(s) were added to cart |
| Buy Now | How many times a customer used a "Buy Now" button on the offer (storefront only) |
A daily breakdown table underneath shows the same metrics broken out by date, with pagination for longer histories.
Note On the promotion-type summary table, Volume Discount campaigns are labeled "Quantity".
Note The Home dashboard's date-range control applies to the storewide chart and summary table. Individual promotion-type and per-campaign detail pages currently show all-time totals rather than a separately adjustable date range.
Best Practices
- Check the promotion-type summary weekly to see which offer type is earning the most, and consider expanding that type to more products.
- Use per-campaign detail to compare similar campaigns (e.g. two different BXGY offers) against each other.
Notes
- Revenue and order figures reflect only orders where this app's discount was actually applied to at least one item - not your store's total sales for that period.
- New campaigns may show no data for a short time until they've received real storefront or checkout traffic.
Troubleshooting
A campaign shows zero views even though it's Active. Confirm its matching storefront block (or checkout extension) has actually been added to your theme or checkout - see Storefront Setup.
My revenue numbers don't match my store's total sales. This is expected - Analytics here only reflects the portion of revenue attributable to this app's promotions, not your full store revenue.